Gen AI Service & Knowledge
Role: UX Lead | Time: ‘25 | Team: CX Service | Tools: Figma
The system (AI Agent) delivers real-time reporting on service request patterns, enabling managers to act quickly as new issues emerge. AI identifies likely root causes within clusters, shifting teams from reactive fixes to proactive problem-solving. It also generates concise cluster summaries, giving managers a clear view of issues without sifting through tickets.
To accelerate knowledge sharing, the application drafts AI-powered knowledge articles directly from cluster data. Teams can refine and publish these for internal or customer use, improving self-service and reducing future ticket volume.
Impact
Time saved in average per SR
25m
Reduction in average authoring time
30%
Numbers of SR’s reviewed
1K+
User Goals
Mapped the goals and needs of primary users, including service managers, service agents, knowledge managers, authors, and AI agents, for the service request cluster dashboard and Gen AI-driven article creation. Focused deeply on the journeys of service managers and knowledge authors, uncovering their goals, stories and pain points to shape design priorities and ensure solutions aligned with real workflows.
User Story
Created narrative user stories for Service Managers and Knowledge Authors to capture key workflows and goals. These stories illustrated how each persona interacts with the application, directly guiding feature prioritization and ensuring the design solved real user needs.
Flow Diagram
Designed a flow diagram to visualize how users interact with service request clustering and AI-generated knowledge articles across the end-to-end process. The diagram mapped user’s touch points, from clustering and root-cause analysis to article drafting, review, and publishing. This artifact became helpful to understand connection between multiple user interfaces, across teams, aligning stakeholders around workflows and clarifying touch points.
User Scenarios
Built on the flow diagram, I mapped key user scenarios by replacing many process boxes with simplified wireframes. Each wireframe illustrated what the user was doing at that stage, highlighted requirements, and captured signature moments in the workflow. This approach made complex interactions tangible, communicated design intent clearly, and ensured that feature priorities aligned with real user needs..
Dashboard
The key screen was cluster dashboard showing average unresolved time on the x-axis, average severity rating on y-axis, the SR volume in size of cluster bubble, the category shown by color, and change in patterns shown by day of the week.
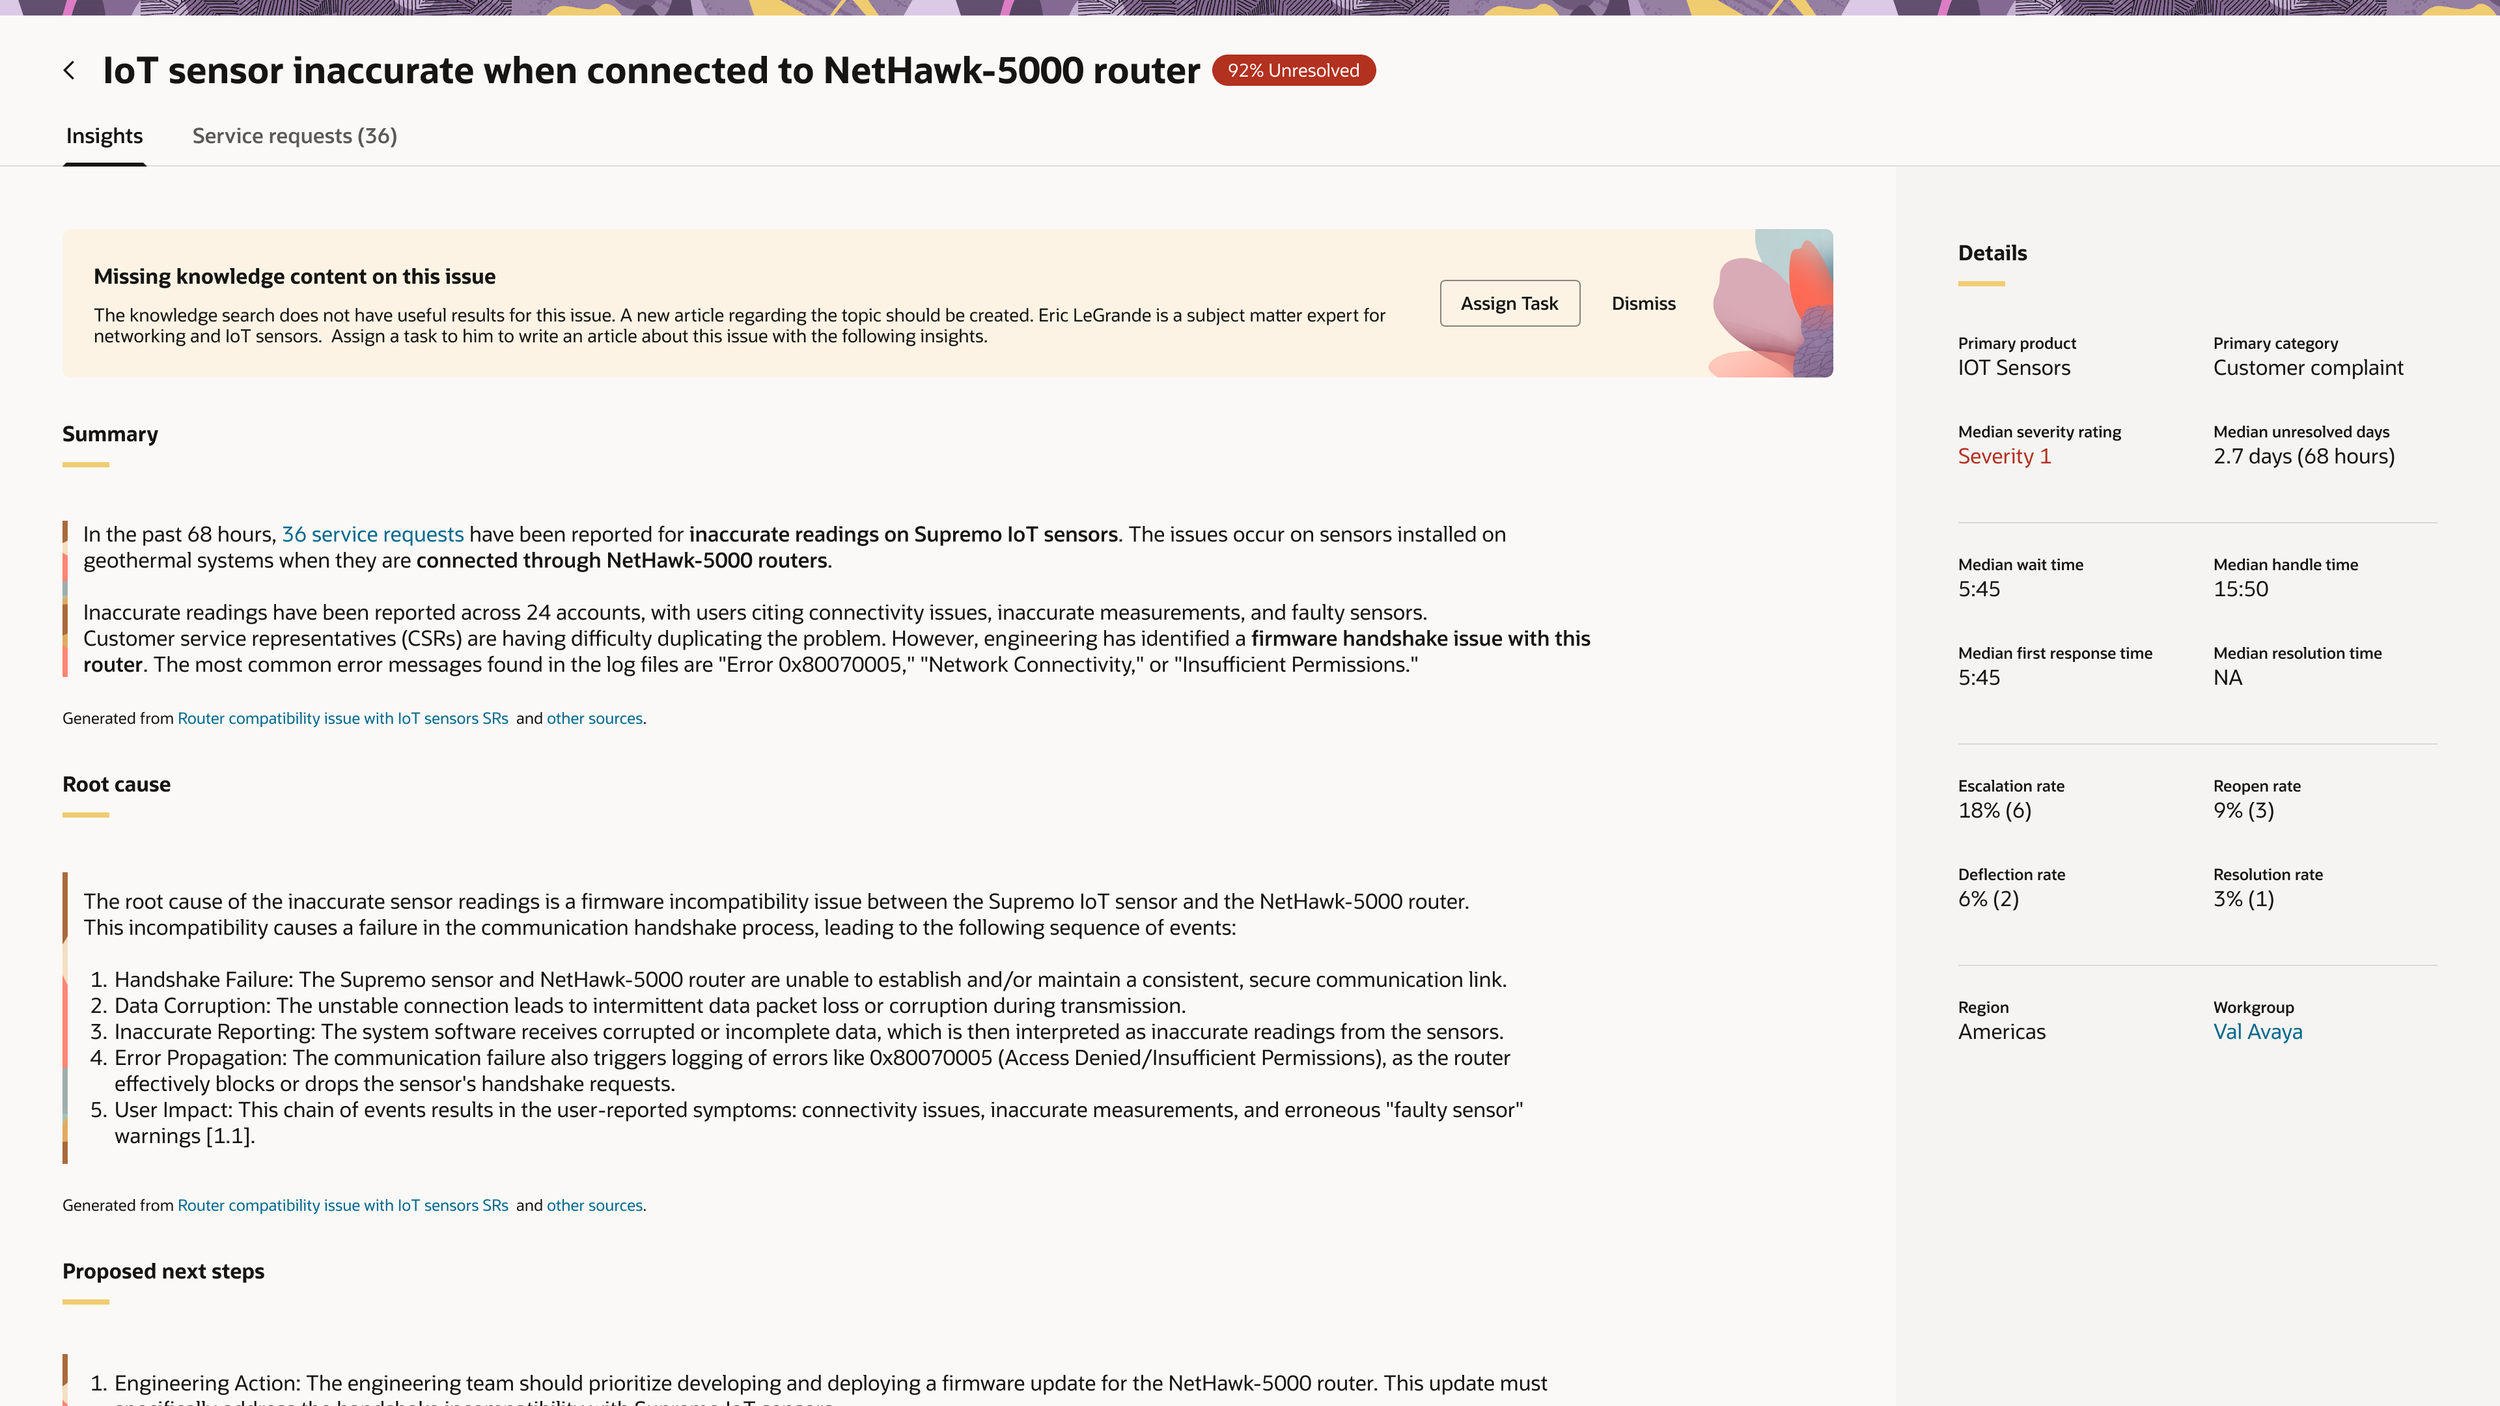
Cluster Summary
The summary page serves provides insights and list of service request for managers and agents. At the top, relevant recommendations surface key actions or alerts, guiding immediate decisions. Below, the cluster summary provides a concise snapshot of grouped service requests, including trends and common patterns. The root cause analysis section highlights AI-identified likely causes, helping teams move from reactive fixes to proactive problem-solving. A proposed next steps area suggests prioritized actions based on insights, while a details panel provides classification for the cluster, enabling informed decision-making without leaving the page.